Empirical Study - Results
For each collected bug in the oracle, we ran MkFault on the buggy Makefile (and the included ones) to produce the
list of suspicious lines in the Makefiles with their suspiciousness scores. We measured MkFault's performance by its
effectiveness score and top-n accuracy.
The effectiveness score E is defined as follows:
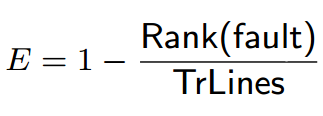
where Rank(fault) is the rank of the faulty line in MkFault's ranked list and TrLines is the number of lines that are involved in the evaluation and execution traces of the Makefile (i.e., the number of lines that a developer would need to inspect using a debugger when detecting the fault). That is, the effectiveness score E is the percentage of lines that need not be inspected by the developer by using MkFault's results. A higher effectiveness score indicates more effort being saved in fault localization. If the faulty line has the same suspiciousness score with other lines, its rank can vary from the smallest to the largest ranking number for that set of lines (called Sfault set). For example, with the following suspiciousness scores assigned to lines L1 to L5: L1=0.7, L2 =0.3, L3=0.5, L4=0.9, L5=0.7, and assuming L1 is faulty, then Sfault=fL1, L5g and L1 can rank either second or third out of the five lines. To address such cases, we compute the effectiveness score as both Ehigh and Elow for the highest and lowest ranks of Sfault (for the previous example, Ehigh = 60% and Elow = 40%).
For top-n accuracy, we count the number of times (or hits) that the faulty line is ranked among the top n of the ranked list returned by MkFault. The top-n accuracy is measured by the ratio of the number of hits over the total number of localization cases.
The results:
| System | List | LOC | TrLines | Ehigh | Elow | Top-1 | Top-5 | Top-10 |
| Actiongame | Cases | 691 | 513 | 100% | 100% | 68-89% | 100-100% | 100-100% |
| Blood Frontier | Cases | 769 | 665 | 100% | 100% | 82-100% | 100-100% | 100-100% |
| Dream Toolbox | Cases | 400 | 127 | 97% | 59% | 7-73% | 53-87% | 60-93% |
| GMod | Cases | 430 | 23 | 88% | 68% | 15-65% | 25-75% | 25-85% |
| X10 | Cases | 262 | 36 | 95% | 76% | 5-75% | 10-80% | 20-95% |
| Average | - | 510 | 273 | 96% | 80% | 35-81% | 58-88% | 61-95% |
For top-n accuracy, each cell has two numbers corresponding to the cases where the faulty line is to be ranked at the highest or the lowest among the set of lines with the same score. As seen, Ehigh is within 88-100%, and Elow is within 59-100%. On average, Ehigh is 96% and Elow is 80%. Thus, MkFault has high effectiveness and could help save debugging effort of up to 96%. Also, MkFault can achieve high accuracy. In up to 81% of the cases, a single recommended location contains the fault. In 58-88% of the cases, one could find the fault in the first 5 recommended lines. The variance in top-n accuracy (e.g., 58-88% for top-5 accuracy) is due to the fact that the faulty line often shares the same suspiciousness score with other lines and their rankings range from less than the n-th rank to more than the n-th rank (i.e., falling out of the top-n result).